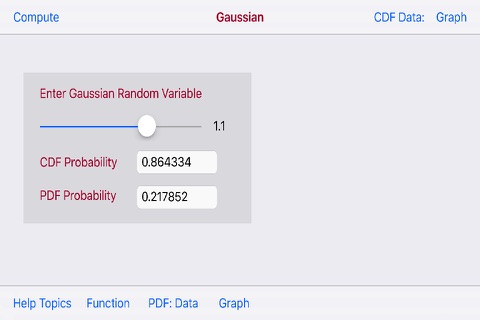
Gaussian Probability app for iPhone and iPad
Developer: Donald Schaefer
First release : 10 Feb 2016
App size: 1.2 Mb
The Gaussian Probability Calculator utilizing the Gaussian Probability Function returns the probability that an entered random variable (x) has a probability value less than the entered (x) value..
The random variable (x) is entered via a numeric data entry field.
In addition the Gaussian Probability Calculator produces a PDF/CDF Graph and PDF/CDF Data Tables producing random variable (x) and the Gaussian probability f(x) a range of random variable (x) values of -3.00 to 3.20
The PDF and CDF graph are touch interactive graphs for computed (x/Pr(x) paired values. The graphs hav a touch feature whereby upon the touch a slidable vertical line appears. Upon movement of the line a paired (x,Pr(x) values appear relative to the line position on the graph curve.
The horizontal x-axis displays computed (x) values. The vertical y-axis plots a range of Pr(x) values.
Horizontal Max and Min dashed lines display the Maximum and Minimum F(x) values
The iOS 12 version add the ability to enter the (x) value on a numeric basis


